
See OEE and downtime as it happens
Most plants can produce an OEE number. Fewer can produce it on a Tuesday afternoon, for one line, without asking someone to build it — which is the only time the number would actually change a decision.
The number, while it still matters
The three components of OEE almost never live in one place. Runtime and stoppages sit in the MES or the machine historian. Good-part counts sit in the quality system. The planned production time they are all measured against sits in a planning workbook somebody maintains. The monthly OEE number exists in a spreadsheet because joining those three by hand is work, and work like that gets done monthly.
Describe the dashboard in a sentence and the Flow appears: it reads all three, joins them on equipment and order, computes availability, performance and quality, and draws them. When someone opens the dashboard the Flow runs, so the numbers are the ones the systems hold right now — not the ones they held when a spreadsheet was last refreshed. There is no warehouse underneath and no copy of your data anywhere.
Availability
Runtime against planned production time, with every stoppage accounted for rather than averaged away.
Performance
Actual output against the rate the operation should run at, so a machine that is up but slow stops hiding.
Quality
Good parts against total parts, taken from the quality system rather than estimated from scrap tickets.
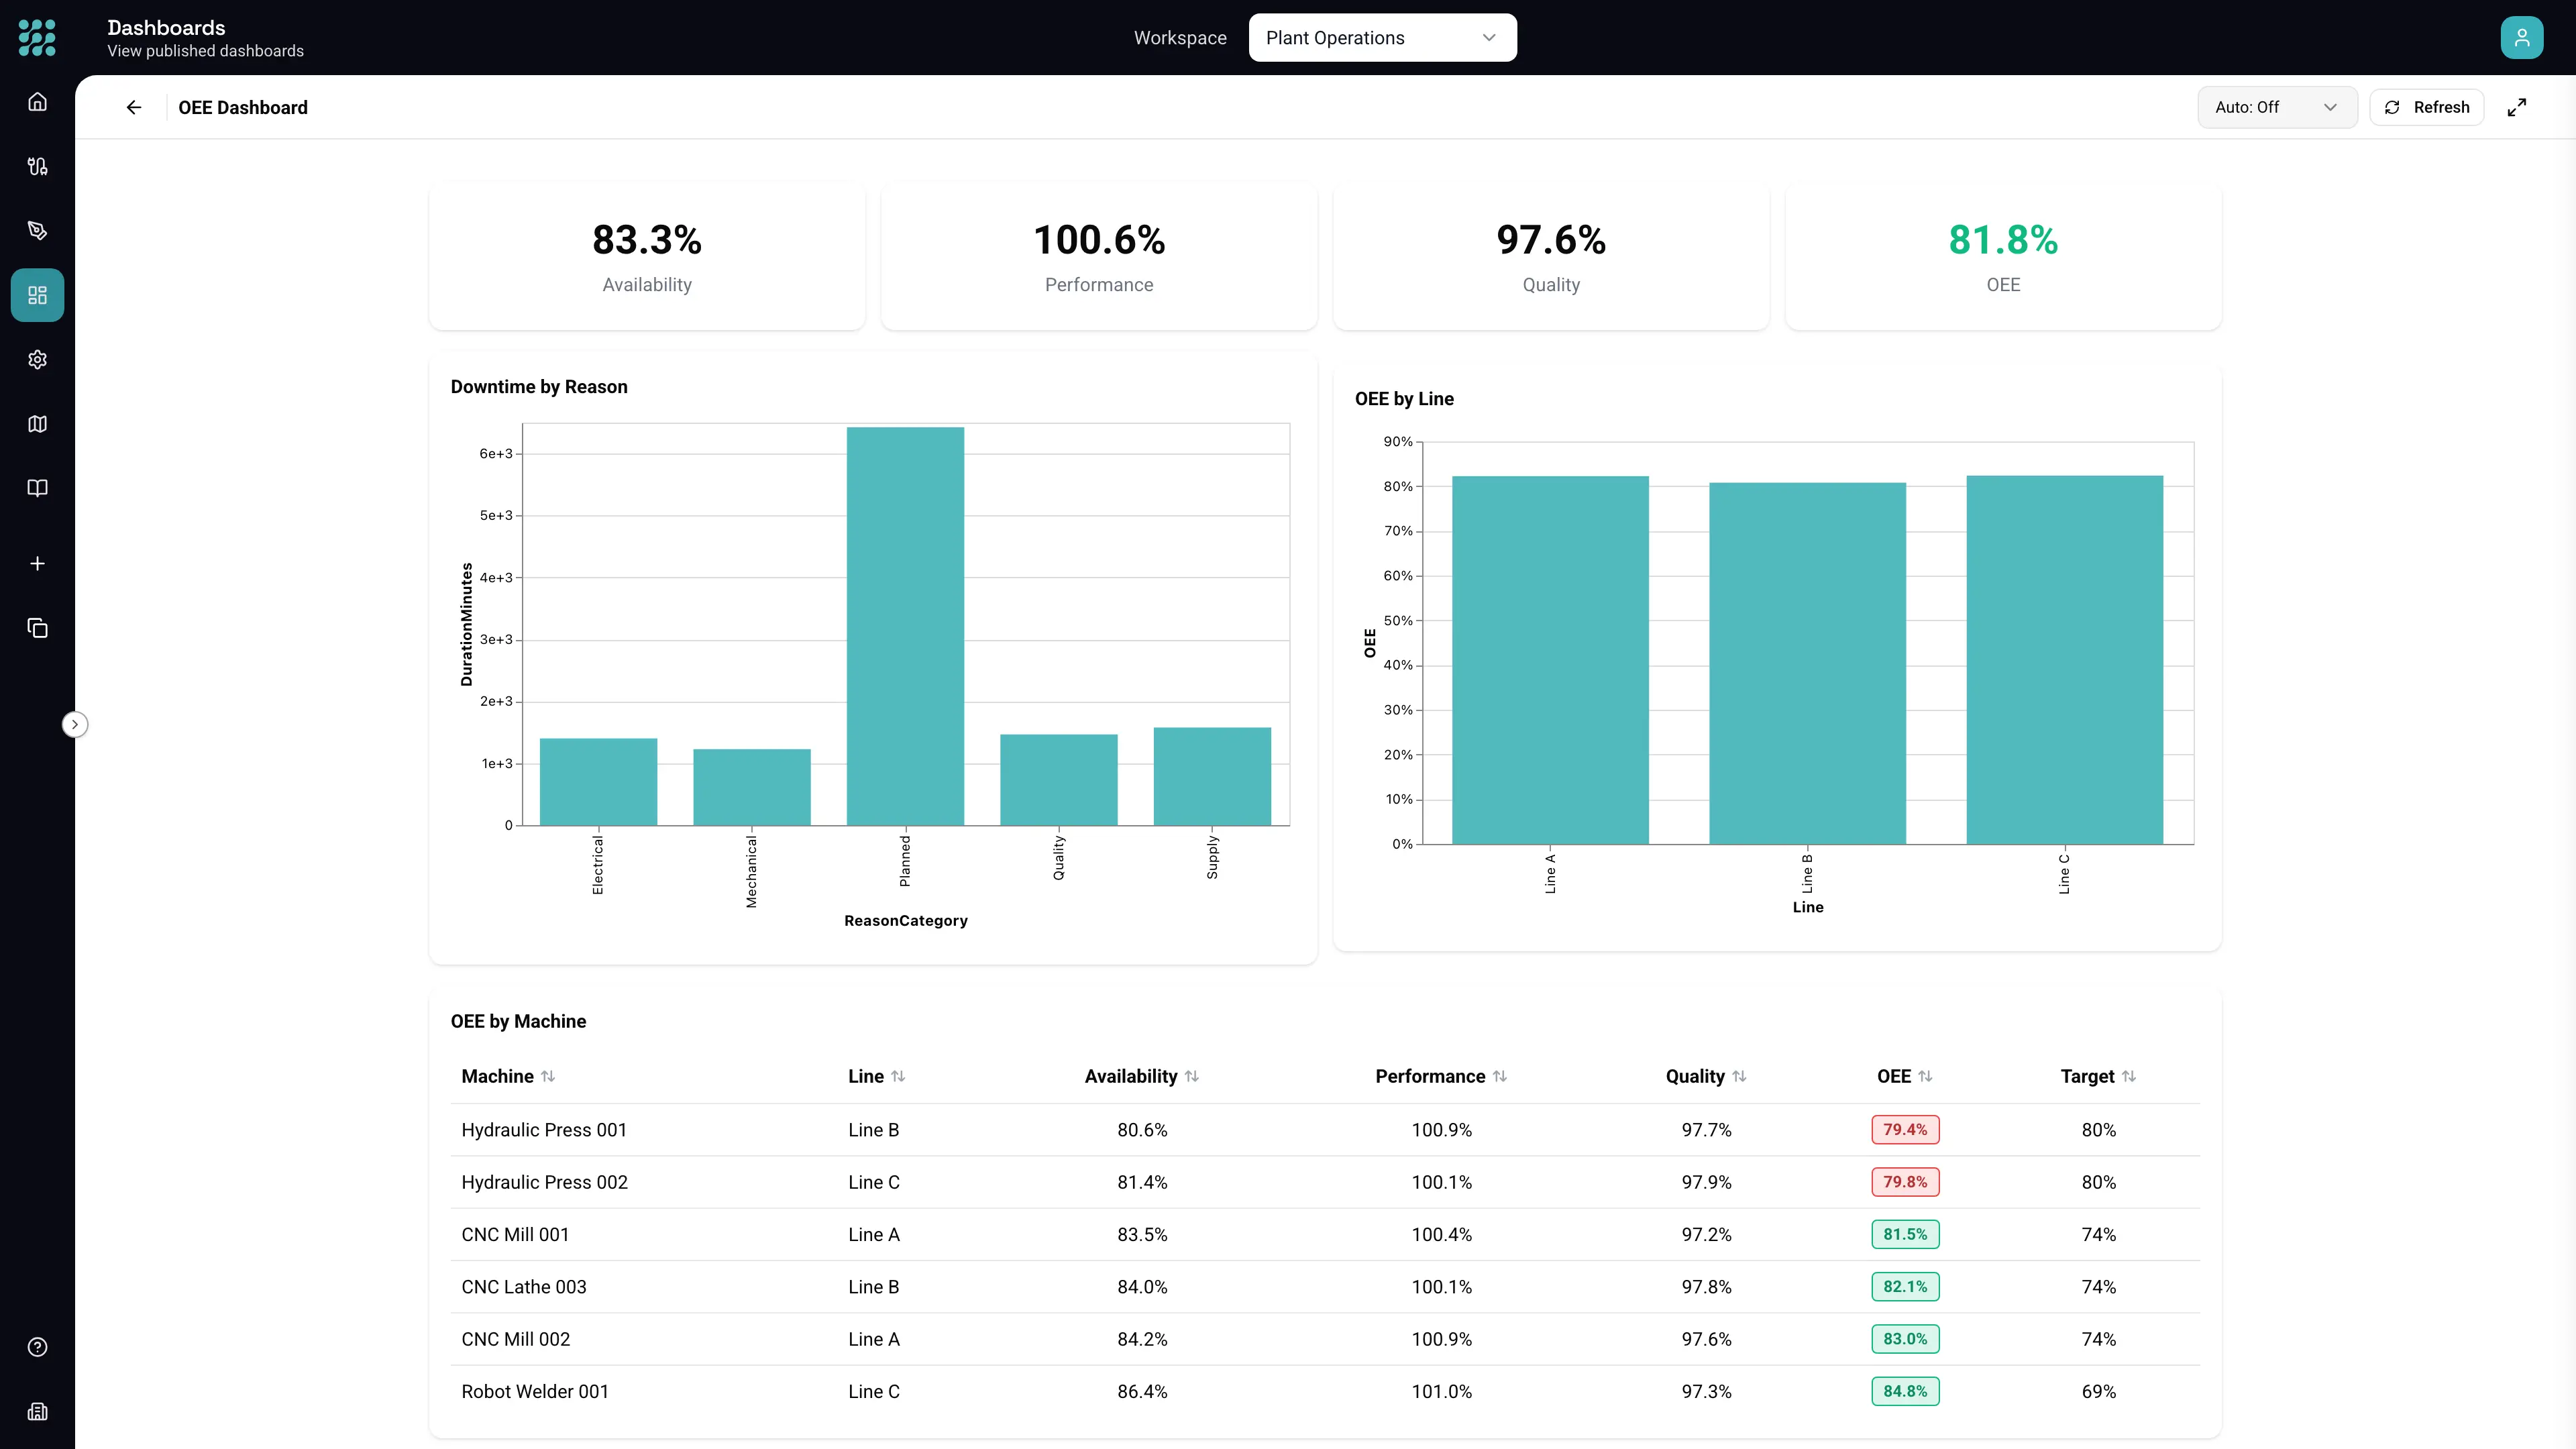
Downtime with a reason attached
An availability percentage tells you there was a problem. A downtime breakdown tells you which one. Stoppages are grouped by reason category, so the argument about whether the constraint is changeovers, material starvation or unplanned failure is settled by the chart rather than by whoever is most confident in the room.
The same dashboard carries targets by line and by shift, because a single plant-wide OEE target is a number nobody owns. A press with an 80% target and a line with a 65% target are each measured against their own, and the per-machine table flags the ones underneath. Anything you can filter, you can drill into.
Why the number is usually wrong
OEE is arithmetic. What makes it hard is that the three inputs were recorded by three systems that were never asked to agree, and every plant discovers the same four problems when it tries to join them.
The machine has three names
The historian calls it by its tag, the MES by its work-centre code, the maintenance system by its asset number. A lookup node resolves them once, on the graph, where the next person can see how.
Planned time is not clock time
Availability against 24 hours flatters nothing and helps nobody. The shift calendar and the planned-maintenance windows have to come into the calculation, and they usually live in a workbook.
Short stops disappear
Stoppages under a threshold get swallowed by whatever aggregated the data first. Reading the events directly, rather than a pre-summarised figure, is what keeps them in — and they are often the biggest single category.
Quality is counted late
Parts scrapped at final inspection belong to the run that made them, not to the shift that found them. Joining on the order rather than the date is the difference between a useful quality rate and a misleading one.
None of that is exotic, and none of it is the real reason the number arrives monthly. It arrives monthly because doing it once takes a day, and doing it continuously used to take a project. Each of those four fixes is a node on a graph you can open and read.
Nobody has to be watching it
A dashboard only helps the people looking at it. The shift that matters most is the one where nobody is looking — so the second thing plants build here is the alert.
Describe it in a sentence and the Flow appears: when a line drops below its target, an email goes out, with the rows that triggered it attached, so the person reading it does not have to go and look. The condition is not a threshold drawn on a chart — it is the Flow itself, so it can be a filter, a join across two systems, a computed column, or a group-by. Whatever you can build, you can be told about.
It works the other way round too: send the email when the Flow returns nothing. No production reported since the shift started is worth knowing, and it is the alert most tools cannot express.