
Dashboards, alerts, and cross-system sync — built the same way
Connect
Point FactoryThread at a system and it reads back what is there — the Entities, their fields, their types — so nothing is typed in by hand. Reading across two systems is the same act as reading from one.
MES / MOM & shop floor. Databases. Files. APIs. Streaming. See the full list
Usually one tool moves the data and another shows it. Nobody owns the question that needs both. Flows can do all three. You describe what you need; the Assistant builds it.
Answer
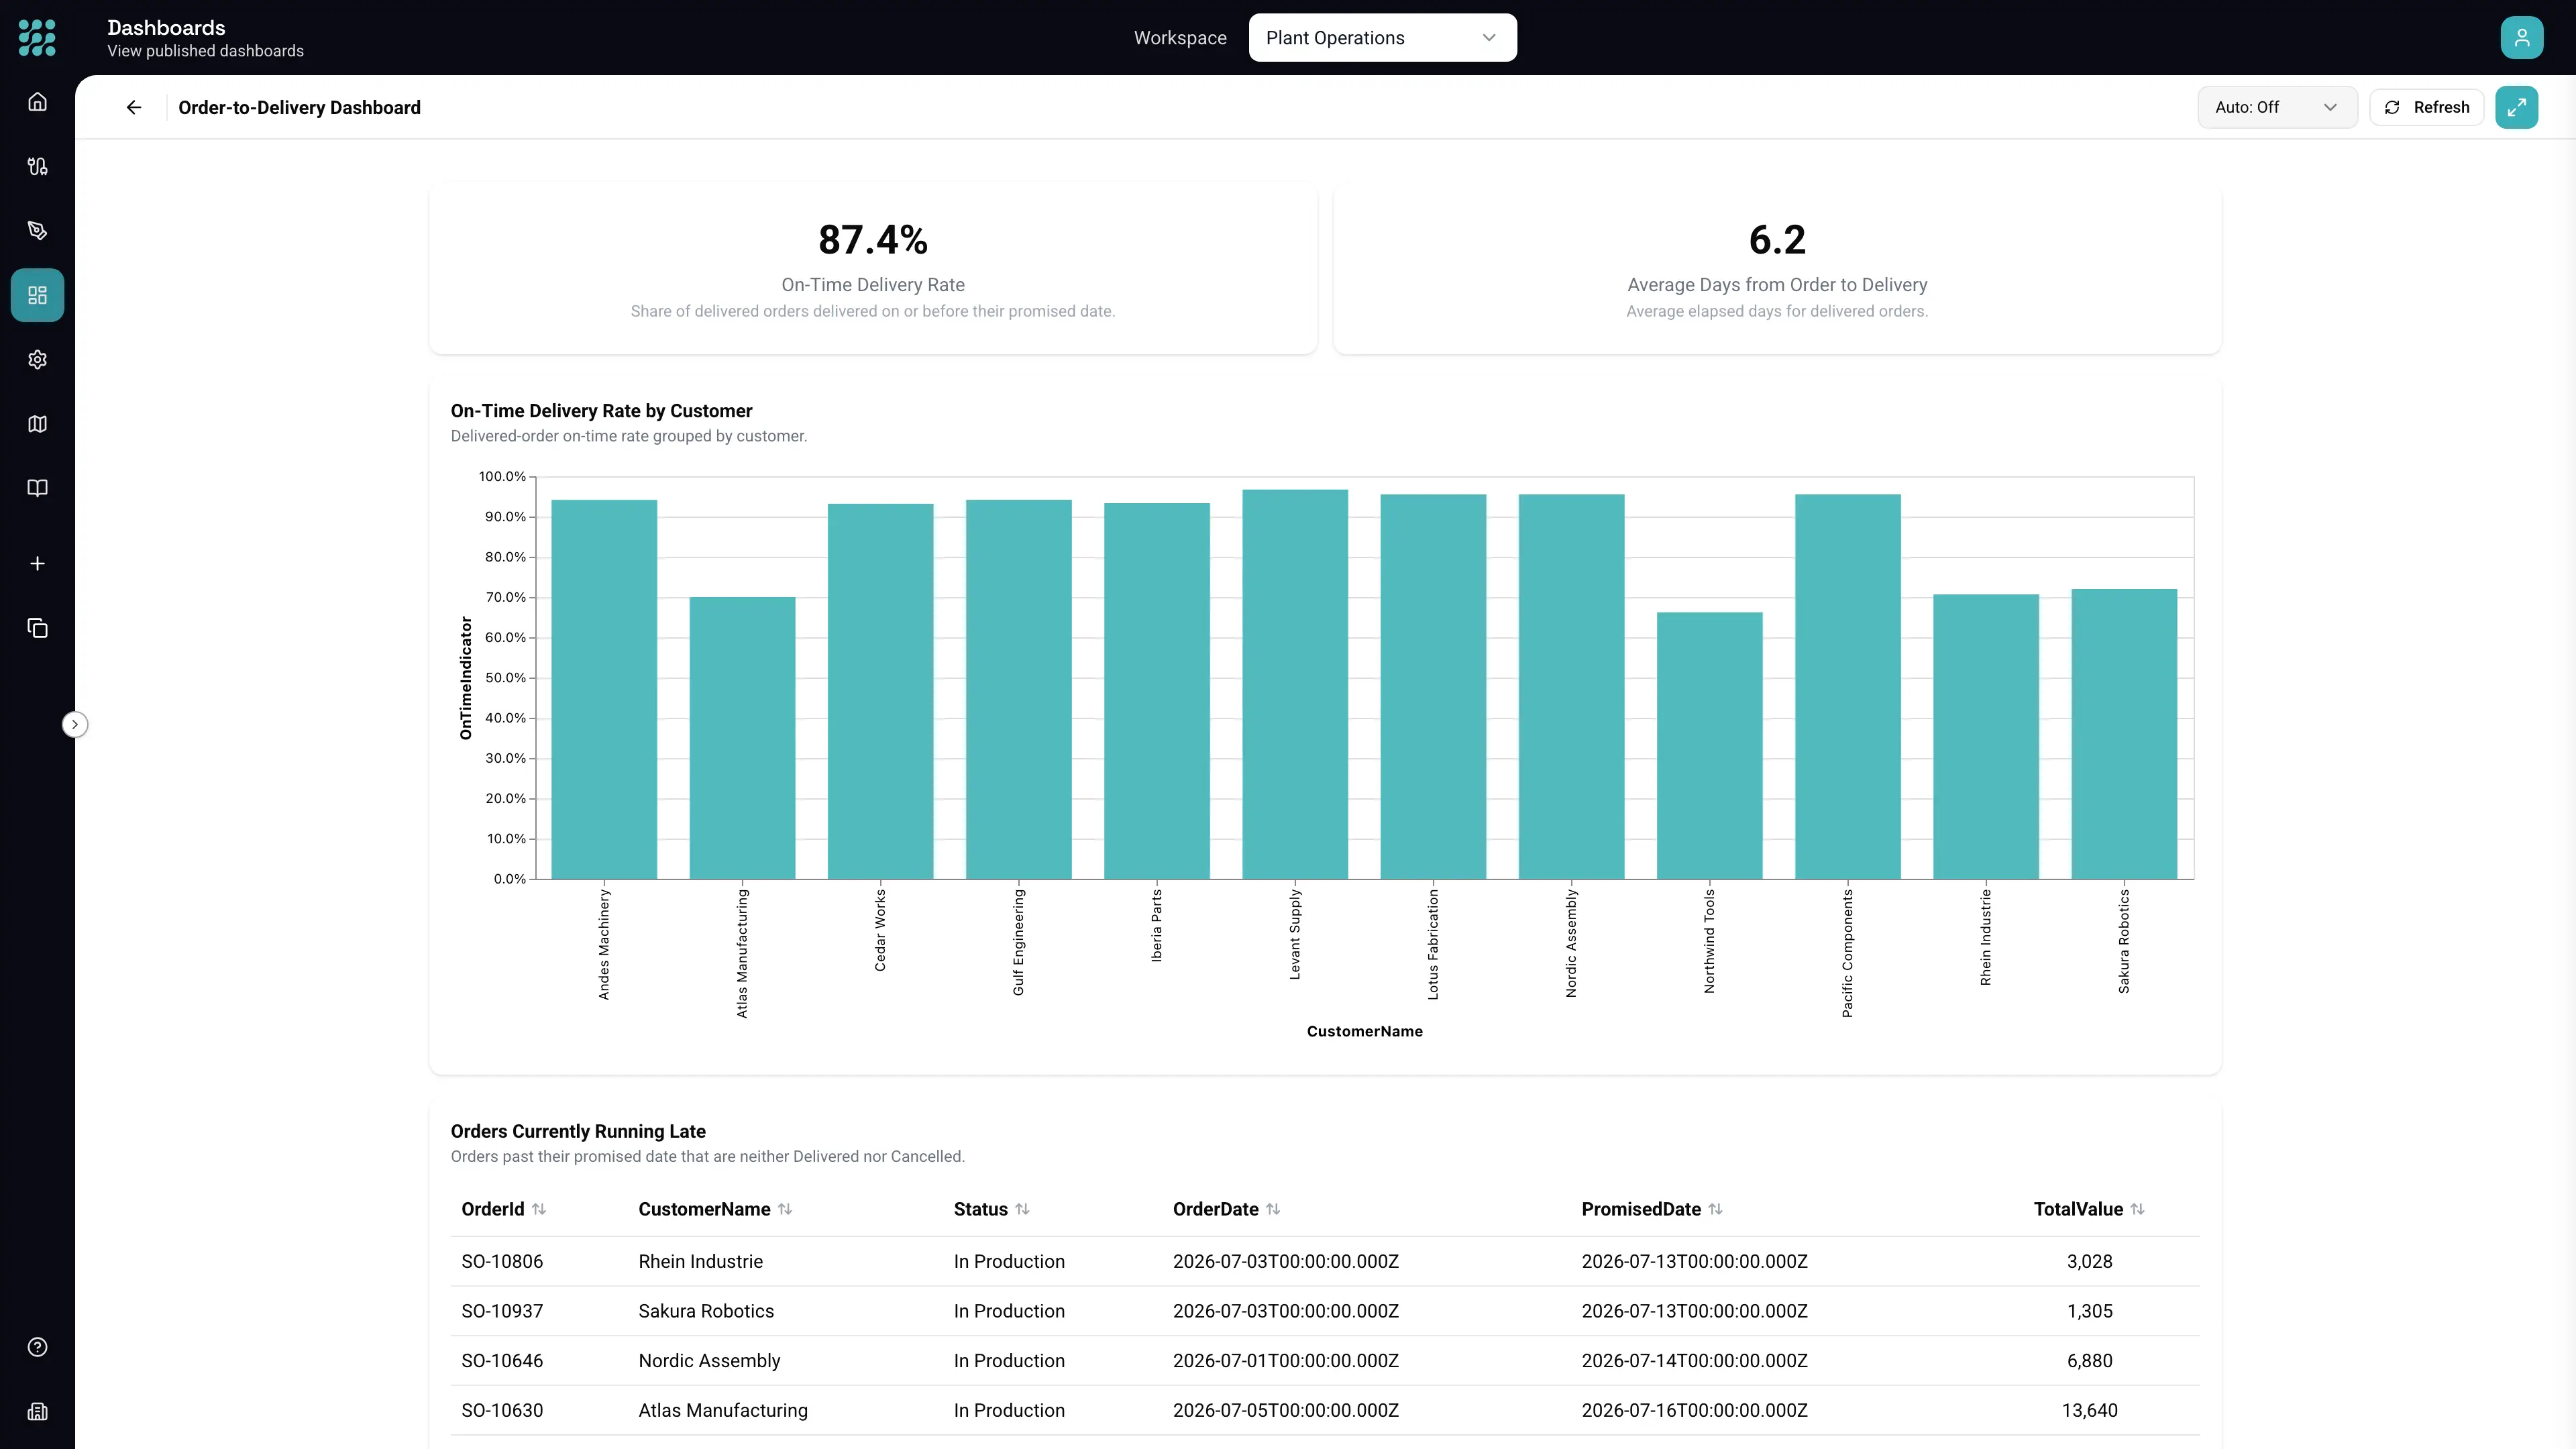
A live dashboard, built straight on the systems that hold the numbers. Nobody has to chase them.
See how Answer works on the Product pageNotify
When a number crosses a line, an email goes out. Nobody has to be watching.
See how Notify works on the Product pageAct
An order closes in one system and the invoice is raised in the other. Nobody has to rekey it.
See how Act works on the Product pageAsk for the dashboard. It reads your systems directly.
One sentence to the Assistant, and the Flow appears: two systems read, joined, grouped, and drawn as KPIs, a chart, and a table. That is the entire build. There is nothing to stand up first, no warehouse underneath, and no copy of your data anywhere — the Flow reads your systems when someone opens the dashboard, so the numbers are the ones your systems hold right now.
The Assistant works from your schema, while you are editing. It builds the Flow that answers the question. It never answers from your data, and it is gone by the time the Flow runs.
Nobody laid this out
There is no width field. No height, no X, no Y, no position — the layout has none of them, so there is nothing to fiddle with and nothing to get wrong. KPIs pack four to a row, charts two, tables full width. Colour is authored as meaning rather than as a hex: danger, warning, success. Legends sit bottom-centre, legend titles are dropped, and thousands get separators — decided once, for every Dashboard, instead of once per chart.
Ask for a fourth KPI and it packs into the row beside the other three. Ask it to flag when the number goes over two days, and it flags.
→ See OEE and downtime as it happens → Know what to make and what to buy
The same answer, wherever they already work
Not everyone wants a dashboard. Publish a Flow as an OData feed and Excel — or your BI tool — connects once to the workspace and sees every feed you have published, that day and every day after, without a second connection. Or publish it as a REST endpoint and let another system call it.
The condition is a Flow, not a threshold on a chart.
Your BI tool can watch a number it has already loaded. This watches anything you can build: a filter on one Entity, a join across two systems, a computed column, a group-by. If the Flow returns rows, the email goes out — and the rows go with it, so the person reading it does not have to go and look.
Email the maintenance team whenever a machine is down for more than ten minutes. One sentence, and the Flow that appears runs on a schedule, filters the downtime events, and mails the ones that qualify — recipients, message, and the columns to include, all authored by the sentence.
It works the other way round too: send the email when the Flow returns nothing. No production reported since the shift started is worth knowing, and it is the alert most tools cannot express.
The change lands in the other system.
A work order finishes on the floor. In the ERP it is still running, until somebody opens both screens and types it across. Ask for it in a sentence and the Flow that appears reads the completed orders from the MES, matches them by work-order number, and writes the finish time and the status into the ERP. On a schedule. Nobody rekeys anything.
Most tools let you look at your data. FactoryThread changes it.
Writes go to databases, files, and APIs. Add new rows, update the ones already there, match on a key and do both, or clear the target and replace it. The write node names the column it matches on and the columns it sets; nothing else in the row is touched.
Connects to what you already run.
- MES / MOM & shop floor
- Siemens Opcenter Execution Core Siemens Opcenter X Siemens Opcenter RD&L Siemens Opcenter APS Plex Scheduler Acumatica OPC UA
- Databases
- Microsoft SQL Server PostgreSQL Amazon Redshift Microsoft Access IBM DB2 InfluxDB
- Files
- File Upload Local Files SharePoint Google Drive
- APIs
- REST OData SOAP
- Streaming
- MQTT i3X / CESMII
Plus any system with a REST, OData, or SOAP API — including ERPs we don't list.
Three things manufacturers build first
Each one is a Flow someone described in a sentence, running against the systems they already had.
IT and ERP managers
Stop Rekeying Between Systems.
Work orders, BOMs, routings and schedules moving between systems on a schedule, instead of moving through a person.
Ops and plant leadership
See OEE and downtime as it happens
Availability, performance and quality pulled live into one dashboard, with an alert when a line drops below target.
Finance and the C-suite
Know what to make and what to buy
What a part costs you to make against what a supplier charges, with the hidden costs surfaced beside the risk.
Run it in production
Four ways a Flow starts
- Schedule
- Every fifteen minutes, hourly, nightly — whatever the run needs.
- HTTP
- Another system calls the Flow and gets the result back.
- MQTT message
- A broker publishes and the Flow runs on the message.
- From Flow
- One Flow calls another, so shared work is written once.
Insights
Every run is recorded with its trigger, its duration, and whether it passed — and on failure, the error that stopped it.
Publish snapshots
What runs in production is the version you published. Edits in progress never leak into a running Flow.
Workspaces, teams and roles
Grants go to users or teams at workspace, Flow and Dashboard level. API keys are scoped to a single workspace.
Deployment
Cloud, single-tenant with region pinning, or self-hosted — including air-gapped, on hardware you own.